RIP Tutorial : 파이차트 그리기, 파이조각(Wedge) 그리기 원리, 캔버스 원형 그라디언트
파이 그래프를 그릴 때 보통은 시작 각도가 0도라서 시계 12시 방향이 아닌 3시 방향부터 그리기 시작한다.
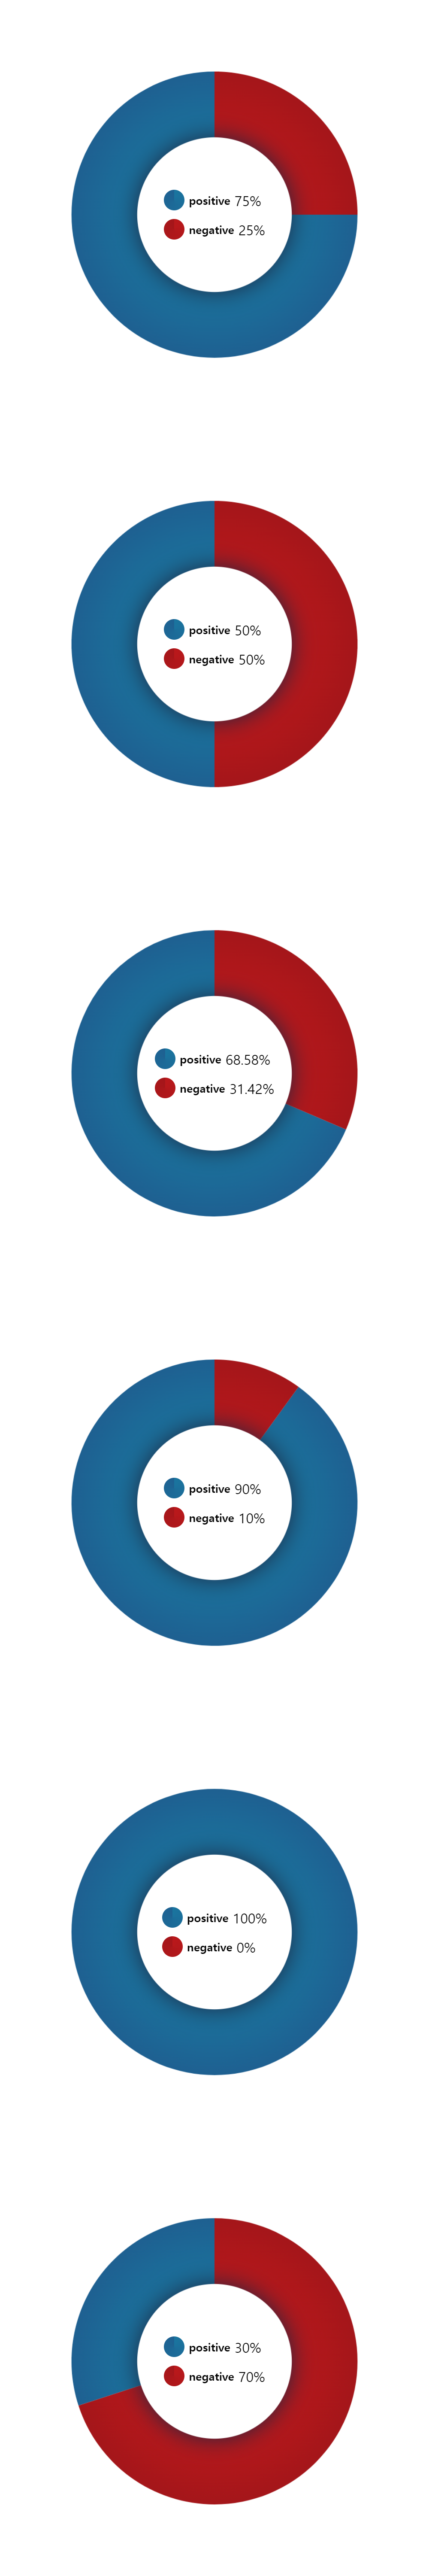
이는 상황에 따라 다르겠지만 보통 긍정적(비율이 크기를 기대) /부정적(비율이 작기를 기대) 2개의 항목이 있는 파이 그래프에서는 아무래도 12시 방향부터 부정적 비율이 그려져야 가독성이 좋을것 같다는 생각을 했음.
기본 RIP 튜토리얼 사이트에 나온것에서 시작 각도만 조정해주면 된다.
여기서 필요한 개념이 라디안(radian)과 각도(degree) 사이의 변환인데, 캔버스에서 arc를 이용하기 위해선 각도를 라디안으로 변형해줄 필요가 있다. (각도는 0도부터 360까지, 라디안은 0부터 약 6.28까지)
JS에서 각도를 라디안으로 변환하는 방법 : const rad = degree * (Math.PI / 180);
360도가 2파이, 180도가 1파이니까 => 1도는 1파이 를 180으로 나눈 값.
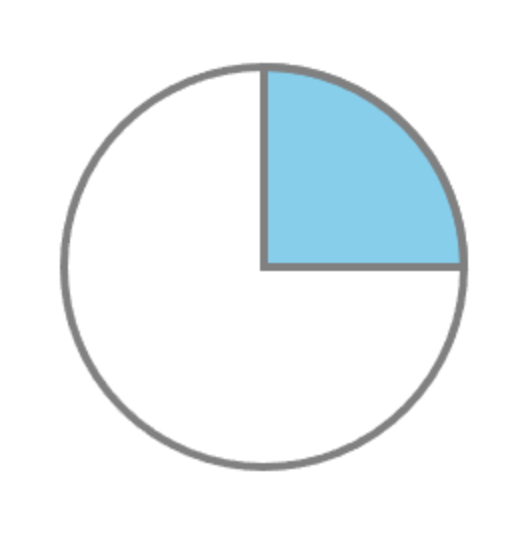
우선 샘플. 12시부터 시작하게 90도를 그리고 싶다면? 이렇게 하면 된다.
|
1
2
3
4
5
6
7
8
9
10
11
12
13
14
15
16
17
18
19
20
21
22
23
24
25
26
27
28
29
30
31
32
33
34
|
const $canvas = document.createElement('CANVAS');
$canvas.width = 500;
$canvas.height = 500;
document.body.appendChild($canvas);
const ctx = $canvas.getContext('2d');
var wedge = {
cx: 150, cy: 150,
radius: 100,
startAngle: -90 * (Math.PI / 180),
endAngle: 90 * (Math.PI / 180)
}
drawWedge(wedge, 'skyblue', 'gray', 4);
console.log(wedge);
function drawWedge(w, fill, stroke, strokewidth) {
const {cx,cy,radius,startAngle,endAngle} = wedge;
ctx.beginPath();
ctx.moveTo(cx, cy);
ctx.arc(cx, cy, radius, startAngle, endAngle + startAngle);
ctx.closePath();
ctx.fillStyle = fill;
ctx.fill();
ctx.strokeStyle = stroke;
ctx.lineWidth = strokewidth;
ctx.stroke();
/* 원 확인용 */
ctx.beginPath();
ctx.arc(w.cx,w.cy,w.radius,Math.PI * 2,false);
ctx.stroke();
}
|
cs |
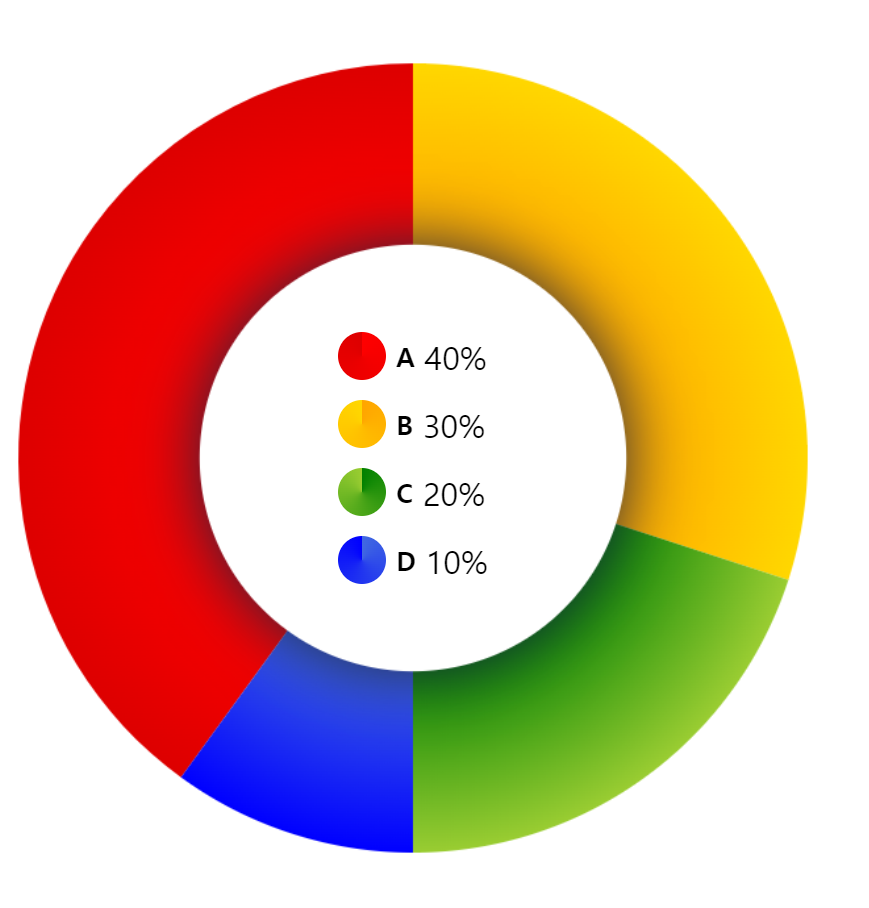
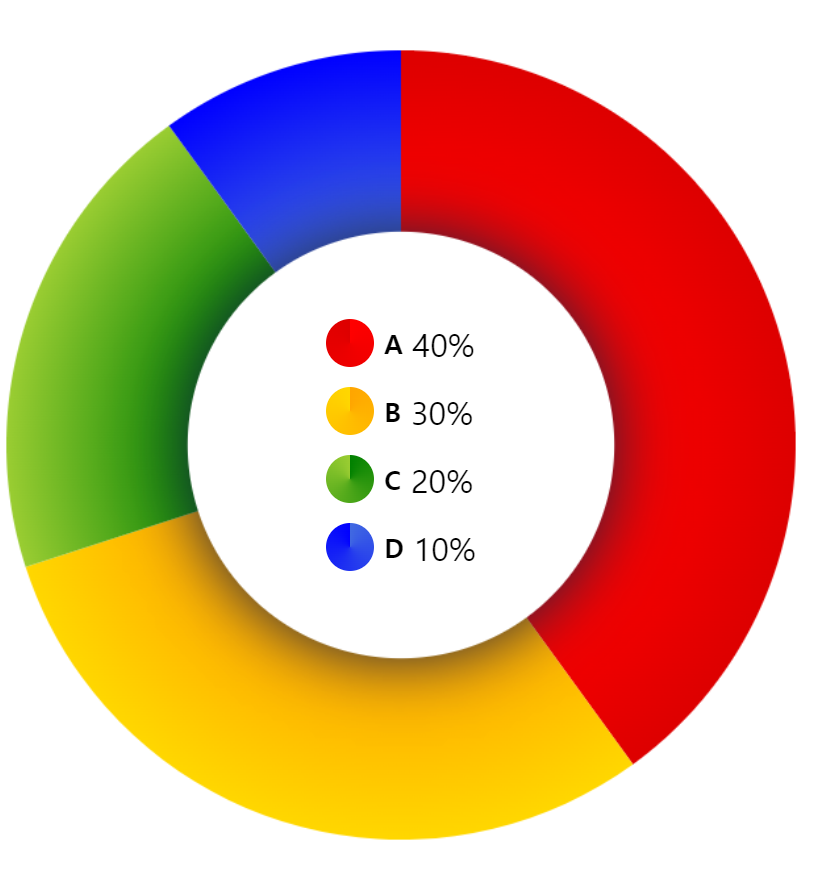
그렇다면 데이터의 갯수가 여러개 들어올땐 어떻게 처리해야할까?
main.js
1 2 3 4 5 6 7 8 9 10 11 12 13 14 15 16 17 18 19 20 21 22 23 24 25 26 27 28 29 30 31 32 33 34 35 36 37 38 39 40 | import { PieChart } from "./PieChart.js"; const dataList = {}; dataList.arrearsStats = [ { "positive": 75, "negative": 25 }, { "positive": 50, "negative": 50 }, { "positive": 68.58, "negative": 31.42 }, { "positive": 90, "negative": 10 }, { "positive": 100, "negative": 0 }, { "positive": 30, "negative": 70 }, ]; /* 01. 데이터 가공 */ const dataPieList = dataList.arrearsStats.map(item => { const result = []; result.push({ title: "positive", value: item["positive"] }); result.push({ title: "negative", value: item["negative"] }); return result; }); /* 그라디언트 */ const gd = [ ["#1a759f", "#1e6091"], ["#ba181b", "#a4161a"], ]; /* 그리기 */ dataPieList.forEach(dataPie => { const $cv = new PieChart() .set_data_pie(dataPie) .set_gradient(gd) .init(); document.body.appendChild($cv); }); | cs |
PieChart.js
1 2 3 4 5 6 7 8 9 10 11 12 13 14 15 16 17 18 19 20 21 22 23 24 25 26 27 28 29 30 31 32 33 34 35 36 37 38 39 40 41 42 43 44 45 46 47 48 49 50 51 52 53 54 55 56 57 58 59 60 61 62 63 64 65 66 67 68 69 70 71 72 73 74 75 76 77 78 79 80 81 82 83 84 85 86 87 88 89 90 91 92 93 94 95 96 97 98 99 100 101 102 103 104 105 106 107 108 109 110 111 112 113 114 115 116 117 118 119 120 121 122 123 124 125 126 127 128 129 130 131 132 133 134 135 136 137 138 139 140 141 142 143 144 145 146 147 148 149 150 151 152 153 154 155 156 157 158 159 160 161 162 163 164 165 166 167 168 169 170 171 172 173 174 175 176 177 178 179 180 181 182 183 184 185 186 187 188 189 190 191 192 193 194 195 196 197 198 199 200 201 202 203 204 205 206 207 208 209 | /** * 🎇🎇🎇🎇🎇🎇🎇🎇🎇🎇🎇🎇🎇🎇🎇 * canvas로 Pie Chart를 만들어 반환합니다 * 🎇🎇🎇🎇🎇🎇🎇🎇🎇🎇🎇🎇🎇🎇🎇 */ export class PieChart { constructor() { this.gradient = []; this.dataPie = []; this.$canvas = null; this.ctx = null; this.cx = null; this.cy = null; this.radius = null; }//constructor /* ----------------------💛[Builder]---------------------- */ /** * 📍 파이 퍼센트 설정 * @param {Array} dataPie 퍼센트 정보가 담긴 배열 * [ {title : KR, value : Number},...] * @returns */ set_data_pie(dataPie) { this.dataPie = dataPie return this; }//set_data_pie /** * 📍 그라디언트 색상 팔레트 설정 * @param {Array} gradient [[color1,color2,color3], [...]]; * @returns */ set_gradient(gradient) { this.gradient = gradient; return this; }//set_gradient /** * 파이그래프 그리기 시작 * @returns {DOM} $wrap */ init() { /* wrap */ this.$wrap = this.make_wrap(); /* 기본 캔버스 설정 */ this.$canvas = this.make_canvas(); this.ctx = this.$canvas.getContext('2d'); this.$wrap.appendChild(this.$canvas); /* 파이 그래프 그리기 */ this.draw_pie(); /* 흰 원 및 라벨 추가 */ this.add_white_circle(); this.$wrap.appendChild(this.make_label()); return this.$wrap; }//init /* ----------------------💛[Func]---------------------- */ /** 📍 파이 그래프 그리기 */ draw_pie() { const data = this.dataPie.map(obj => obj.value); const TOTAL = data.reduce((acc, curr) => acc + curr, 0); const SWEEPS = [] data.forEach(per => { SWEEPS.push((per / TOTAL) * Math.PI * 2); }); let accumAngle = -90 * (Math.PI / 180) - SWEEPS[0]; SWEEPS.forEach((sweep, idx) => { this.draw_wedge(accumAngle, accumAngle + sweep, this.gradient[idx], idx); accumAngle += sweep; }); }//draw_pie /** 📍 draw wedge */ draw_wedge(startAngle, endAngle, fill, idx) { /* draw Arc */ this.ctx.beginPath(); this.ctx.moveTo(this.cx, this.cy); this.ctx.arc(this.cx, this.cy, this.radius, startAngle, endAngle, false); /* fillStyle */ const bgGrad = this.ctx.createRadialGradient(this.cx, this.cy, this.radius / 2, this.cx, this.cy, this.radius); const per = 1 / fill.length; let perTotal = 0; for (let i = 0; i < fill.length; i++) { bgGrad.addColorStop(perTotal, fill[i]); perTotal += per; if (i == fill.length - 2) perTotal = 1; }//for this.ctx.fillStyle = bgGrad; /* shadow */ if (idx) { this.ctx.shadowColor = fill[2]; this.ctx.shadowBlur = 10; this.ctx.shadowOffsetX = -3; this.ctx.shadowOffsetY = 3; } /* end */ this.ctx.fill(); this.ctx.closePath(); this.ctx.shadowColor = 'rgba(0,0,0,0)'; }//draw_wedge /** 중앙에 흰 원 추가 */ add_white_circle() { /* arc */ this.ctx.beginPath(); this.ctx.fillStyle = "#ffffff"; this.ctx.arc(this.cx, this.cy, this.radius / 1.85, 0, 2 * Math.PI, false) /* shadow */ this.ctx.shadowColor = '#1c2541'; this.ctx.shadowBlur = this.radius / 6; this.ctx.shadowOffsetX = 0; this.ctx.shadowOffsetY = 0; /* end */ this.ctx.fill(); this.ctx.closePath(); this.ctx.shadowColor = 'rgba(0,0,0,0)'; }//add_white_circle /* ----------------------💛[Dom Maker]---------------------- */ /** * 📍 make wrap * @returns {DOM} wrap */ make_wrap() { const $wrap = document.createElement('DIV'); $wrap.style.display = 'flex'; $wrap.style.flexFlow = 'column nowrap'; $wrap.style.justifyContent = 'center'; $wrap.style.alignItems = 'center'; $wrap.style.position = 'relative'; return $wrap; }//make_wrap /** * 캔버스 만들어 반환 * @returns {DOM} canvas */ make_canvas() { const wid = 900; const $canvas = document.createElement('CANVAS'); $canvas.width = wid; $canvas.height = wid; $canvas.style.width = '100%'; $canvas.style.aspectRatio = '1/1'; this.cx = wid / 2; this.cy = this.cx; this.radius = wid / 3; return $canvas; }//make_canvas /** * 📍 * 라벨 만들어 추가 * @returns {DOM} */ make_label(){ const $labelWrap = document.createElement('SECTION'); $labelWrap.style.display = 'flex'; $labelWrap.style.flexFlow = 'column nowrap'; $labelWrap.style.justifyContent = 'center'; $labelWrap.style.alignItems = 'flex-start'; $labelWrap.style.gap = '10px'; $labelWrap.style.position = 'absolute'; this.dataPie.forEach((item,idx)=>{ const {title,value} = item; const $row = document.createElement('DIV'); const $lbl = document.createElement('P'); const $title = document.createElement('SPAN'); const $value = document.createElement('SPAN'); $row.style.display = 'flex'; $row.style.alignItems = 'center'; $row.style.position = 'relative'; $row.style.gap = '5px'; $lbl.style.height = "1.5em"; $lbl.style.aspectRatio = '1/1'; $lbl.style.background = `conic-gradient(${this.gradient[idx].join(',')})`; $lbl.style.borderRadius = '50%'; $title.style.fontWeight = '600'; $title.style.fontSize = "13px"; $title.textContent = title; $value.textContent = `${value}%`; $row.appendChild($lbl); $row.appendChild($title); $row.appendChild($value); $labelWrap.appendChild($row); }); return $labelWrap; }//make_label }//class-PieChart | cs |
'CSS&JS > ⚡Thinkers' 카테고리의 다른 글
| [JS]부모에만 mousedown,mouseup,mousemove를 적용하고 자식에는 click만 적용하고 싶을 때 (0) | 2023.08.31 |
|---|---|
| [JS] .animate() 또는 setTimeout과 Promise로 marquee 효과 만들기 (0) | 2023.07.13 |
| [JS]바닐라 자바스크립트로 slick slider 간단히 구현해보기 (0) | 2023.01.20 |
| [JS]Draggable & Resize 모달창 (0) | 2022.12.19 |
| 달력 만들기(3) + To Do List (0) | 2022.12.15 |